Master Data Analytics & Visualization.
Turn Data Into Actionable Business Insights.

Data Analytics & Visualization Course

This program starts by helping you understand what data really shows. Step by step, you learn how numbers reveal patterns, how trends explain behavior, and how insights support smart decisions. Through hands-on practice and real business scenarios, you work with tools, visuals, and analysis methods that prepare you for analyst roles, marketing intelligence, and business problem-solving.

6 Months Advanced Program | 100% Placement Assistance & Career Mentorship

Upcoming Batch

25 February (Offline/Online)

Interactive Sessions

Program Duration

4 Months For Offline/Online

Only 10 Seats Per Batch

Eligibility Criteria

After 10th Class

Career Growth Starts After 10th

Internship

Duration: 2 Month

Project Base Internship

Our Course Modules

The learning journey moves from basics to real decision-making. Each module builds clarity, confidence, and analytical thinking.

You begin with understanding data types and use cases, then practice spreadsheets using formulas, tables, charts, and simple dashboards.

Next, you learn how structured data is explored by writing queries that organize, filter, and combine information from datasets.

You then work with programming logic and numbers, learning how calculations, probability, and testing support clear conclusions.

Here, raw information turns visual as you create charts, graphs, and heat views that explain trends clearly.

You build interactive views that help teams track performance using filters, fields, and connected visuals.

You discover hidden patterns by studying datasets deeply and converting findings into meaningful reports.

You apply everything by working on real scenarios, organizing data, extracting insights, and presenting outcomes.

Finally, you showcase your work through portfolios and prepare confidently for interviews and analytics roles.

Tools You’ll Master

Hands-on experience analyzing, interpreting, and visualizing real-world data to drive actionable business insights and informed decisions.

Power BI

Excel

Google Sheet

MySQL

Python

Tableau

Looker Studio

Google Analytics

Gemini AI

Pandas

NumPy

Matplotlib

Seaborn

About Our Trainer

Hello..... I’m Khivraj Sain

A dedicated Data Analytics Trainer with strong expertise in Excel, SQL, Power BI, Tableau, and Python. I specialize in teaching students how to analyze data, visualize insights, and build meaningful dashboards. With a practical and industry-focused approach, I help learners develop real analytical skills that prepare them for jobs in the data field. My goal is to make data simple, understandable, and career-ready for every student.

Results That Define Success

Yuvtrainings alumni are driving data-led decisions, transforming companies, and leading projects across India’s fastest-growing industries.

95%

 Placement Success

50+

Hiring Partners Nationwide

40%

Average Salary Growth

500+

Learners & Alumni Network

Career Opportunities

In Data Analytics & Visualization

Data Analyst

Business Intelligence

Data Engineer

Machine Learning Engineer

Database Administrator

BI Developer

Data Visualization Specialist

AI-Powered Analytics

Key Highlights of the Program

Master Data Analytics & Visualization

Learn through real datasets, AI-driven analytics, and hands-on projects to build high-demand skills for data-driven roles and informed business decision-making.

6 Months Advanced Professional Program

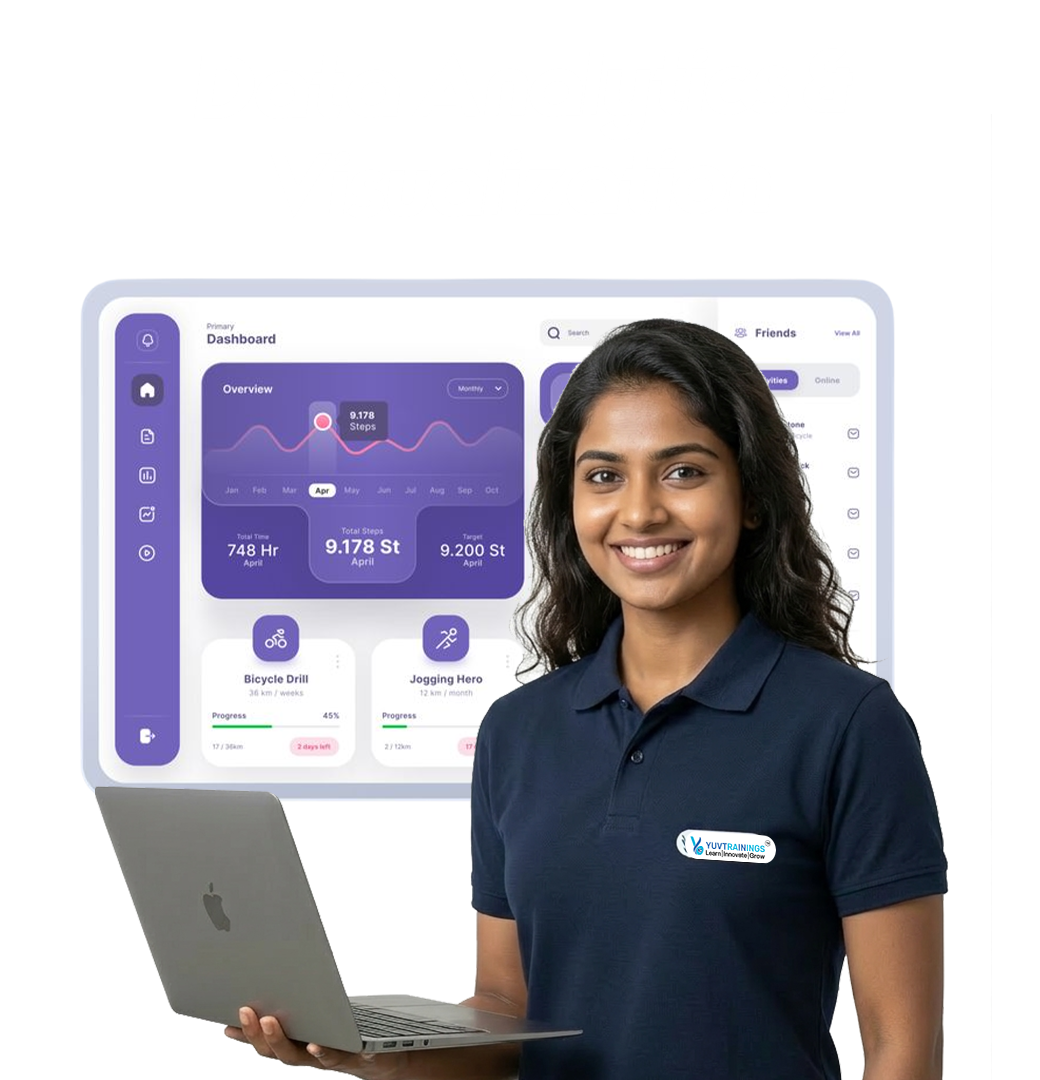
Hands-on Real Projects & Dashboards

100% Job & Career Assistance

Real-time Business Data Simulations

Dual Focus: Data Analytics + Visualization

AI-Integrated Analytics Strategies

Expert Mentorship & Career Guidanc

Globally Recognized Certifications

Certifications You’ll Earn

Gain industry-aligned certifications that validate your expertise in Data Analytics & Visualization:

Turn Data Into Business Impact

Upgrade your skills in data analysis, visualization, and AI-driven insights with real datasets, interactive dashboards, and industry-aligned training built for measurable results.

Start your Yuvtrainings Journey

Connect with us today and take the first step toward a job-ready career in Digital Marketing with E-Commerce with Yuvtrainings

course enqure

Frequently Asked Questions

It focuses on converting data into clear insights and visuals that support smarter business decisions across industries.

Students, freshers, and working professionals from any background can enroll. The course suits both beginners and experienced learners.

No. The program starts from basics and covers Excel, SQL, and Python step by step.

Excel, SQL, Python, Power BI, Tableau, data visualization, statistics, and EDA techniques.

Roles include Data Analyst, Business Analyst, MIS Executive, Data Visualization Specialist, Reporting Analyst, and Junior Data Scientist.

Talk to Our – Counsellor Today

Miss Aarti Sachani

Connect With Us